Blazars as sources of astrophysical neutrino flux
Neutrino emission from the direction of the blazar TXS 0506+056 prior to the IceCube-170922A alert
June 14, 2024
Introduction
Blazars
Introduction
Blazars
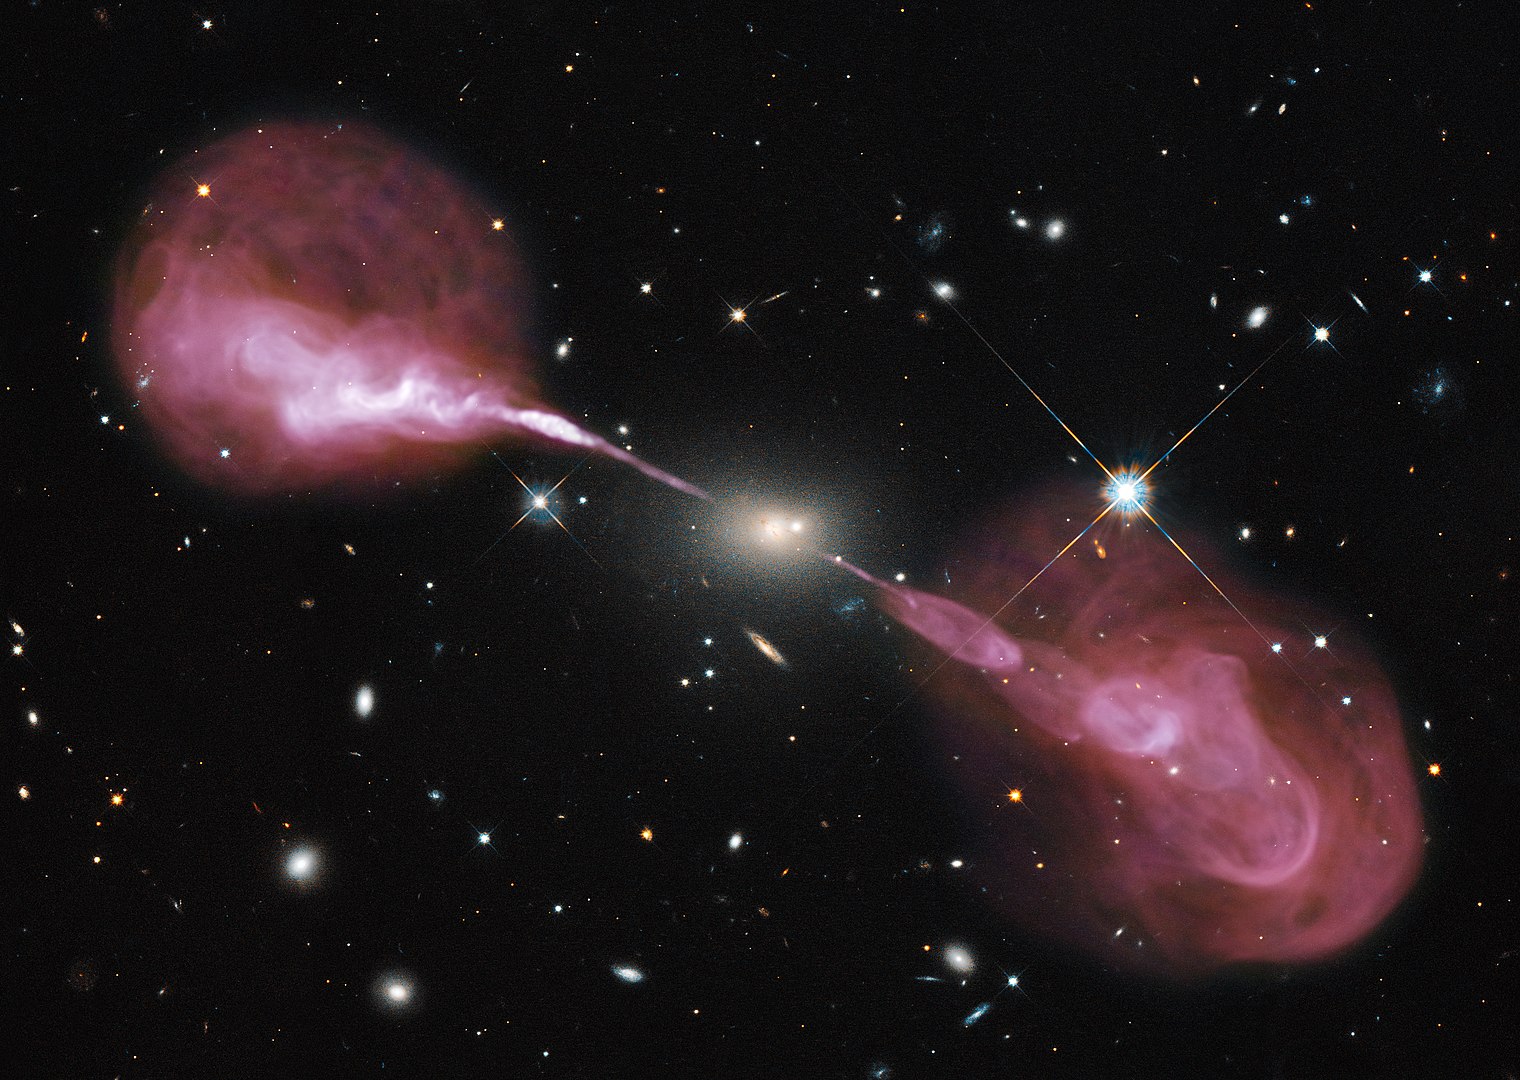
Radio Galaxy Hercules: Visible light by Hubble Space Telescope superposed with a radio image taken by the Very Large Array.
Blazars as Neutrino Sources:
- Type of active galactic nucleus with powerful jets aimed towards Earth.
- Sources of emission across the EM spectrum with high-energy gamma ray photons.
- Prominent candidates for the sources of high-energy neutrino emissions.
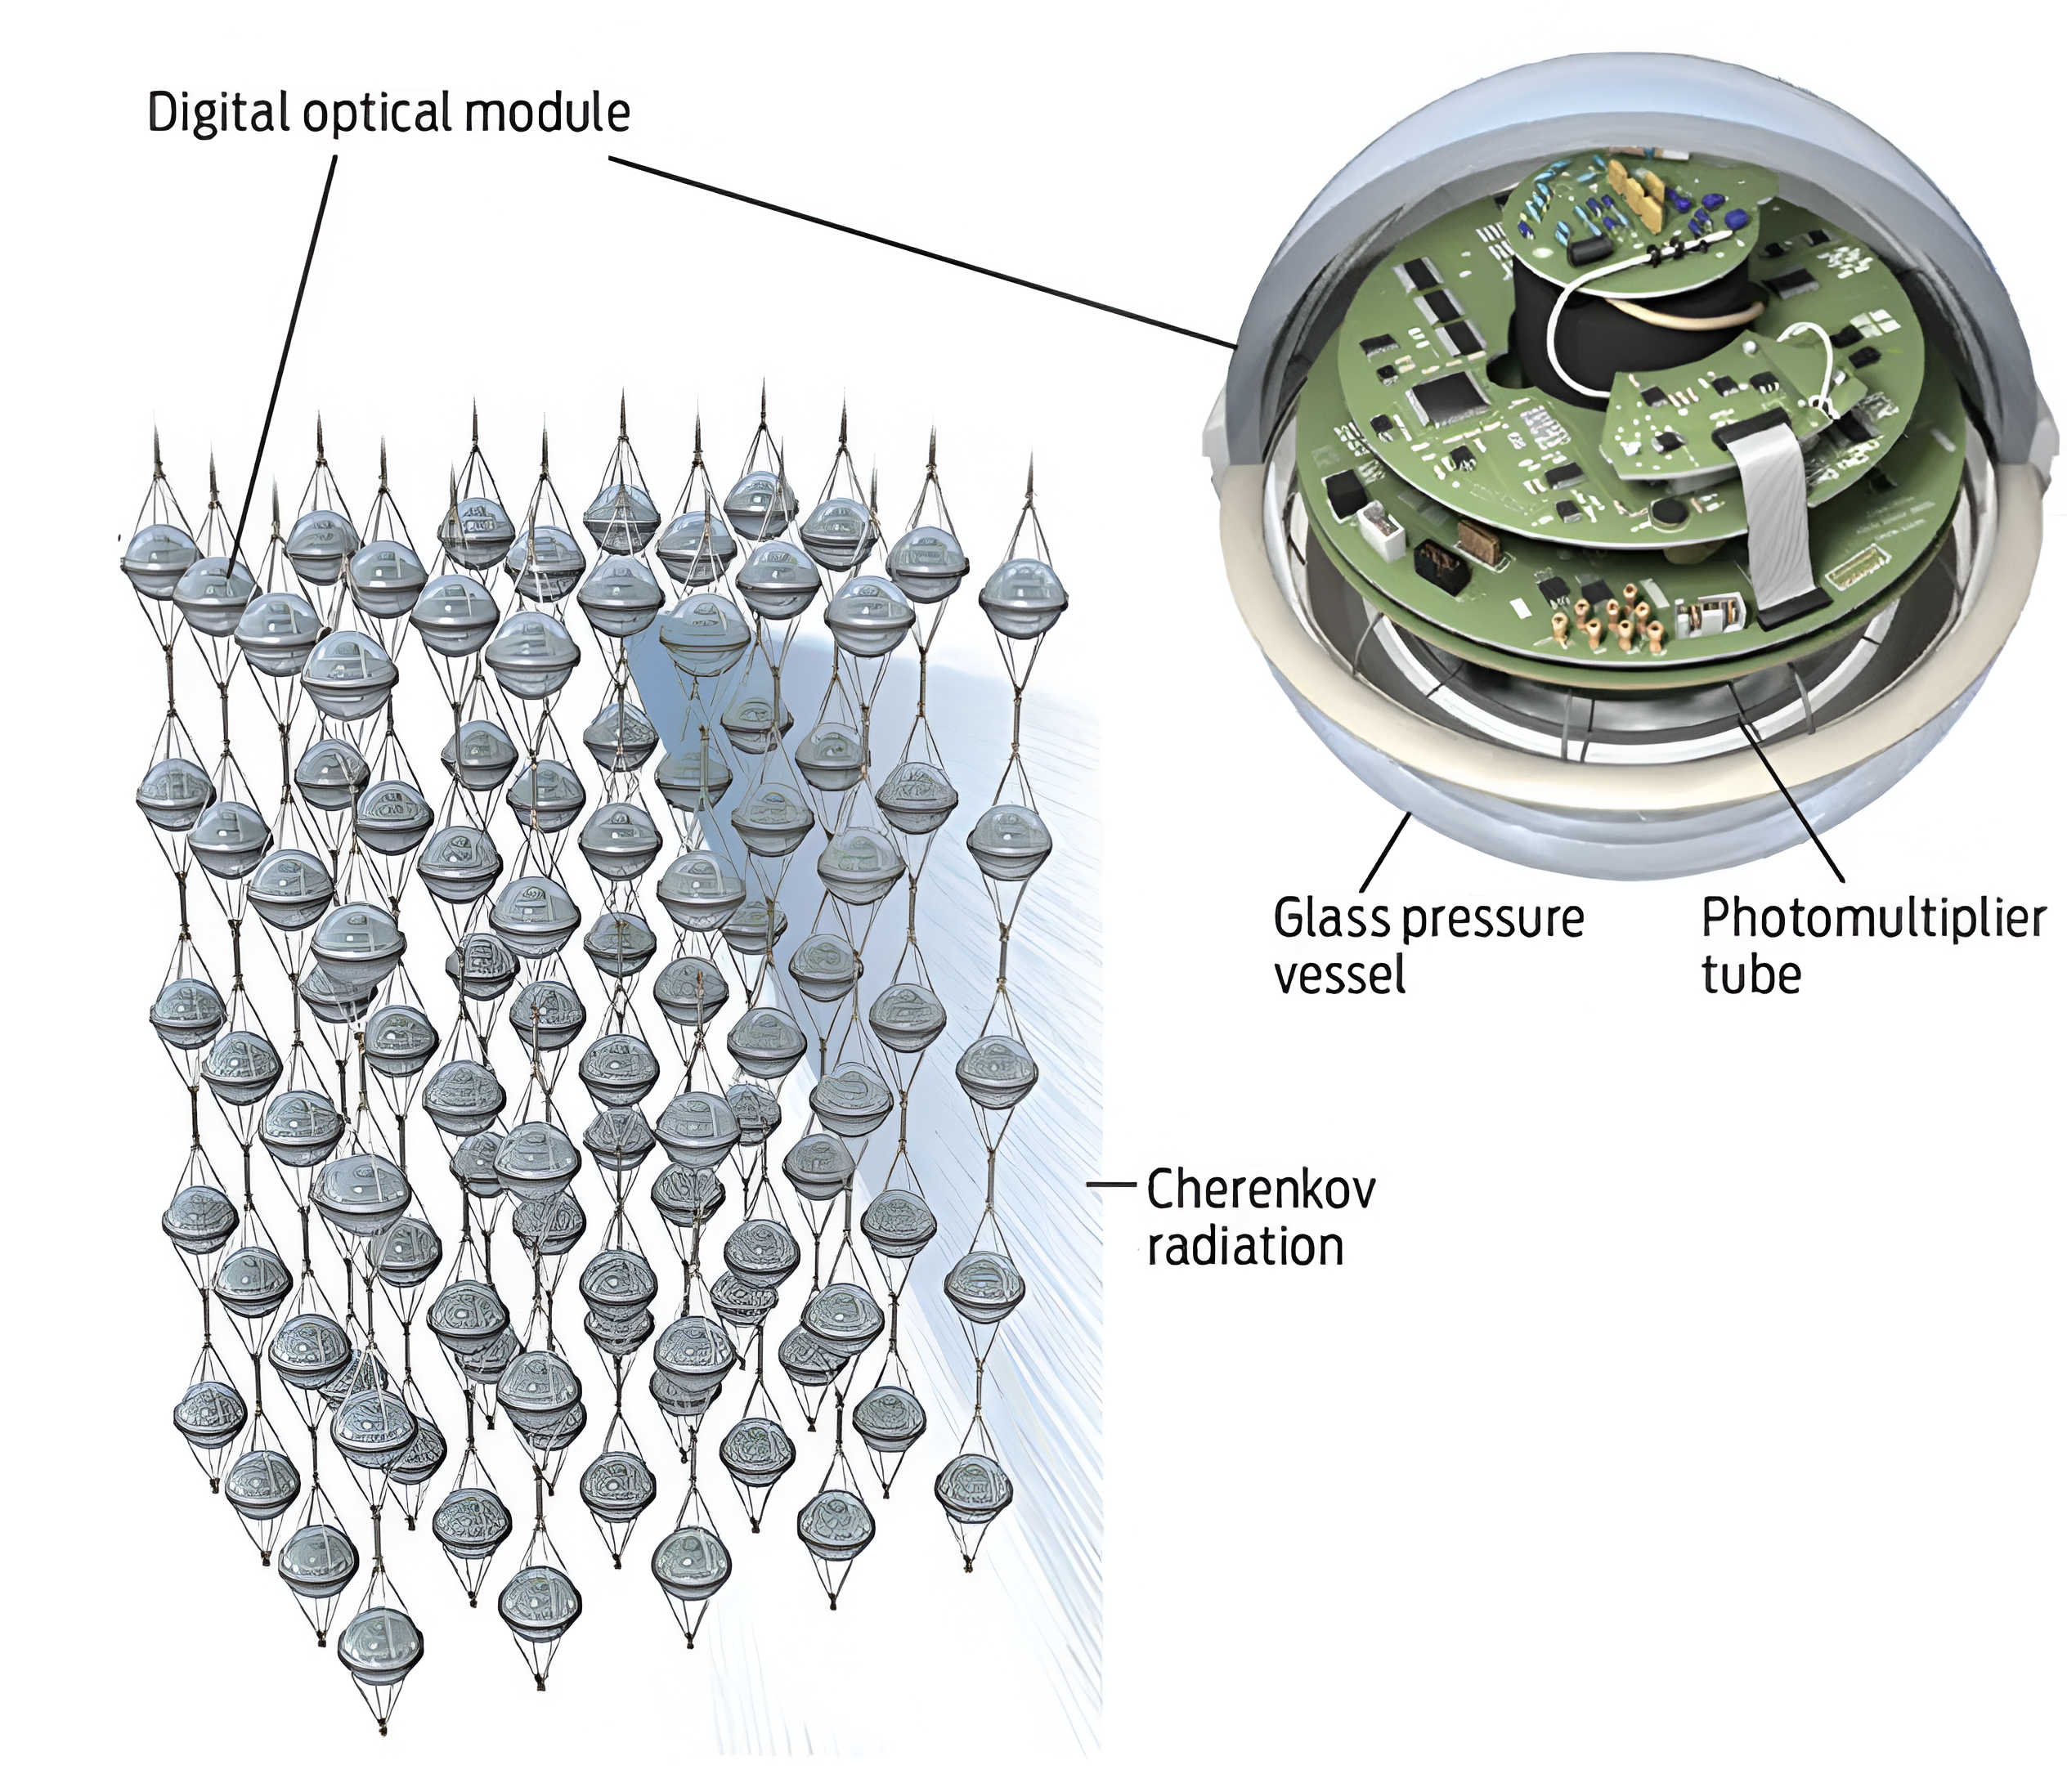
IceCube Detector
Neutrino Observatory
- Location: Amundsen-Scott South Pole Station, Antarctica
- Volume: 1 km³ of instrumented Antarctic ice
- Detector Array:
- 86 vertical strings, spaced 125 m apart
- Strings extend to a depth of 2450 m, with 60 optical sensors each
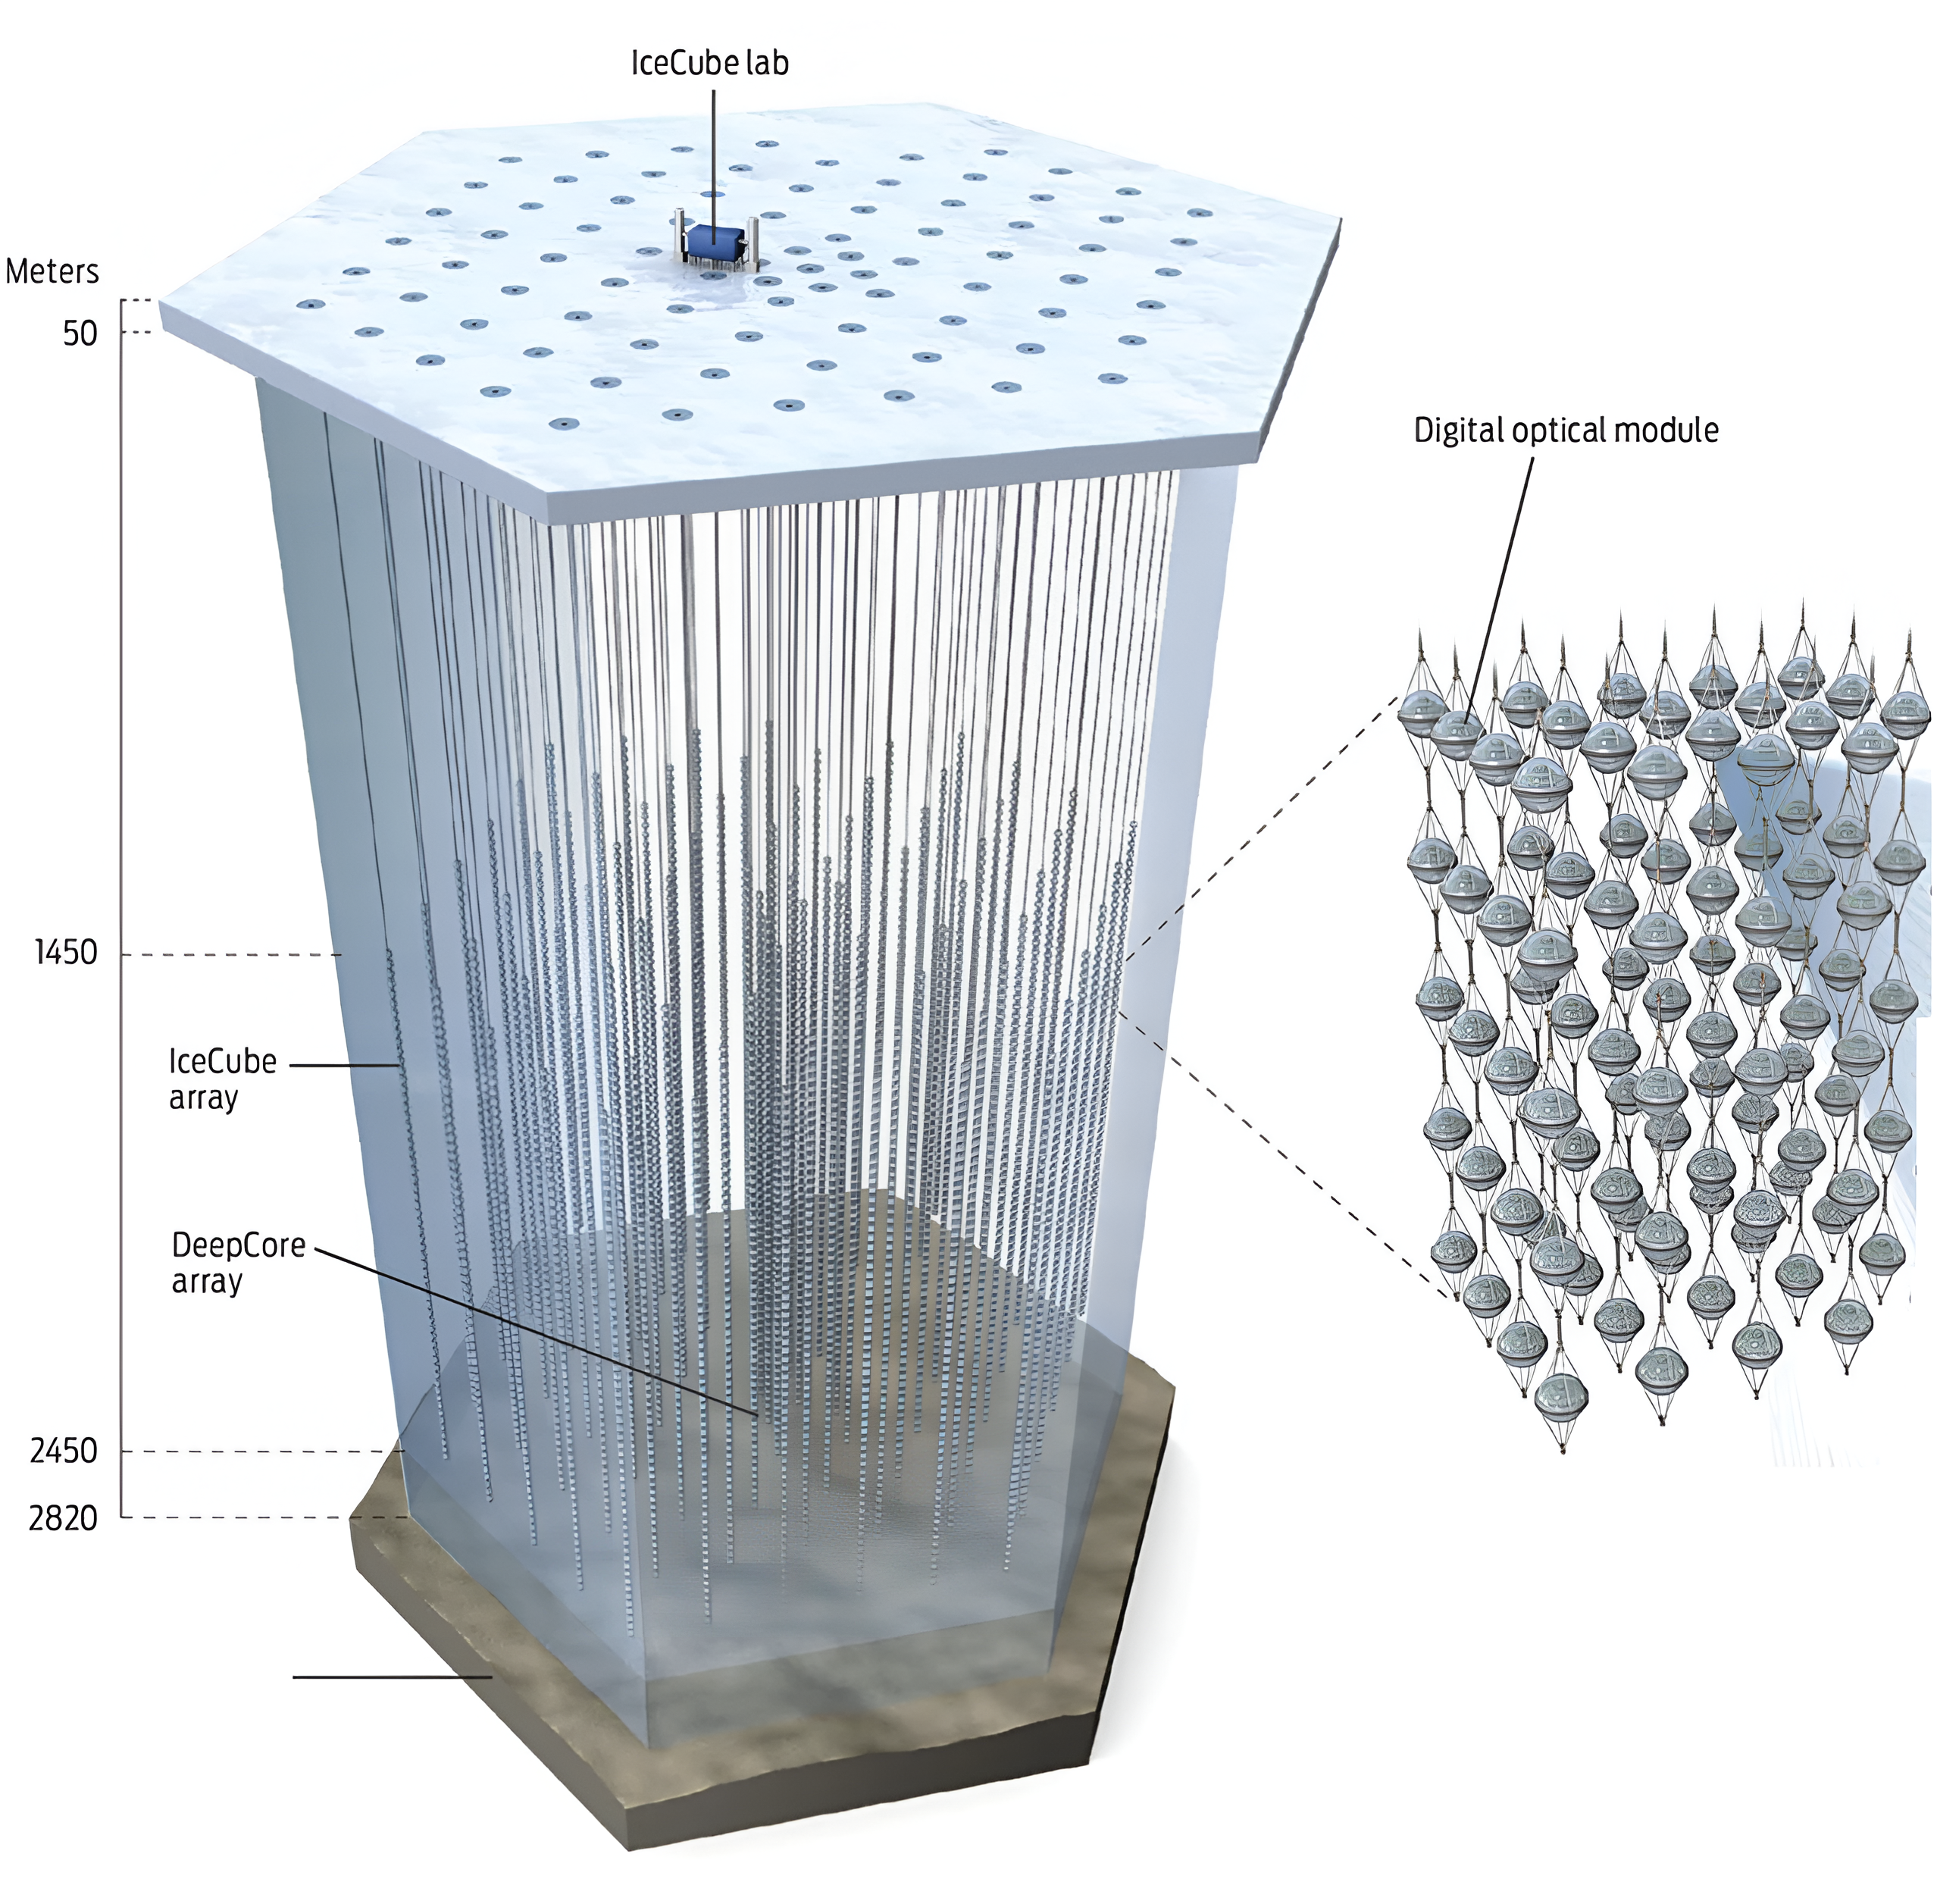
[Illustration: Emily Cooper]
IceCube Detector
Neutrino Observatory
Detection Mechanism:
- Records Cherenkov light from relativistic particles produced by neutrino interactions
- Tracks high-energy muon neutrinos, enabling direction reconstruction with ~0.5° accuracy at 30 TeV
[Illustration: Emily Cooper]
Analysis Techniques
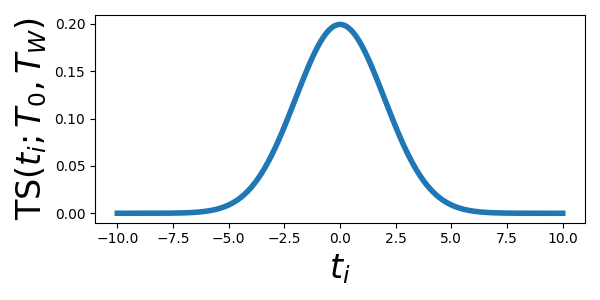
Signal Temporal Distribution Functions
\[ TS(t_i; T_0, T_W) = \frac{1}{T_W} \]
\[ \quad \text{for} \quad T_0 - \frac{T_W}{2} < t_i < T_0 + \frac{T_W}{2} \]
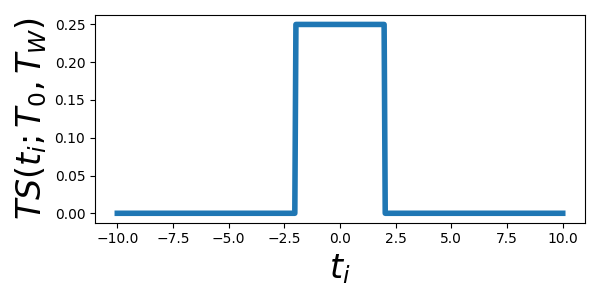
\[ TS(t_i; T_0, T_W) = \frac{1}{\sqrt{2\pi (T_W/2)^2}} e^{-\frac{(t_i - T_0)^2}{2 (T_W/2)^2}} \]
Background Temporal Distribution Functions
Approximated as uniform over the observation period \(T\):
\[ TB(t_i) = \frac{1}{T} \]
Neutrinos from the direction of TXS 0506+056
Results of Time-Dependent Analysis
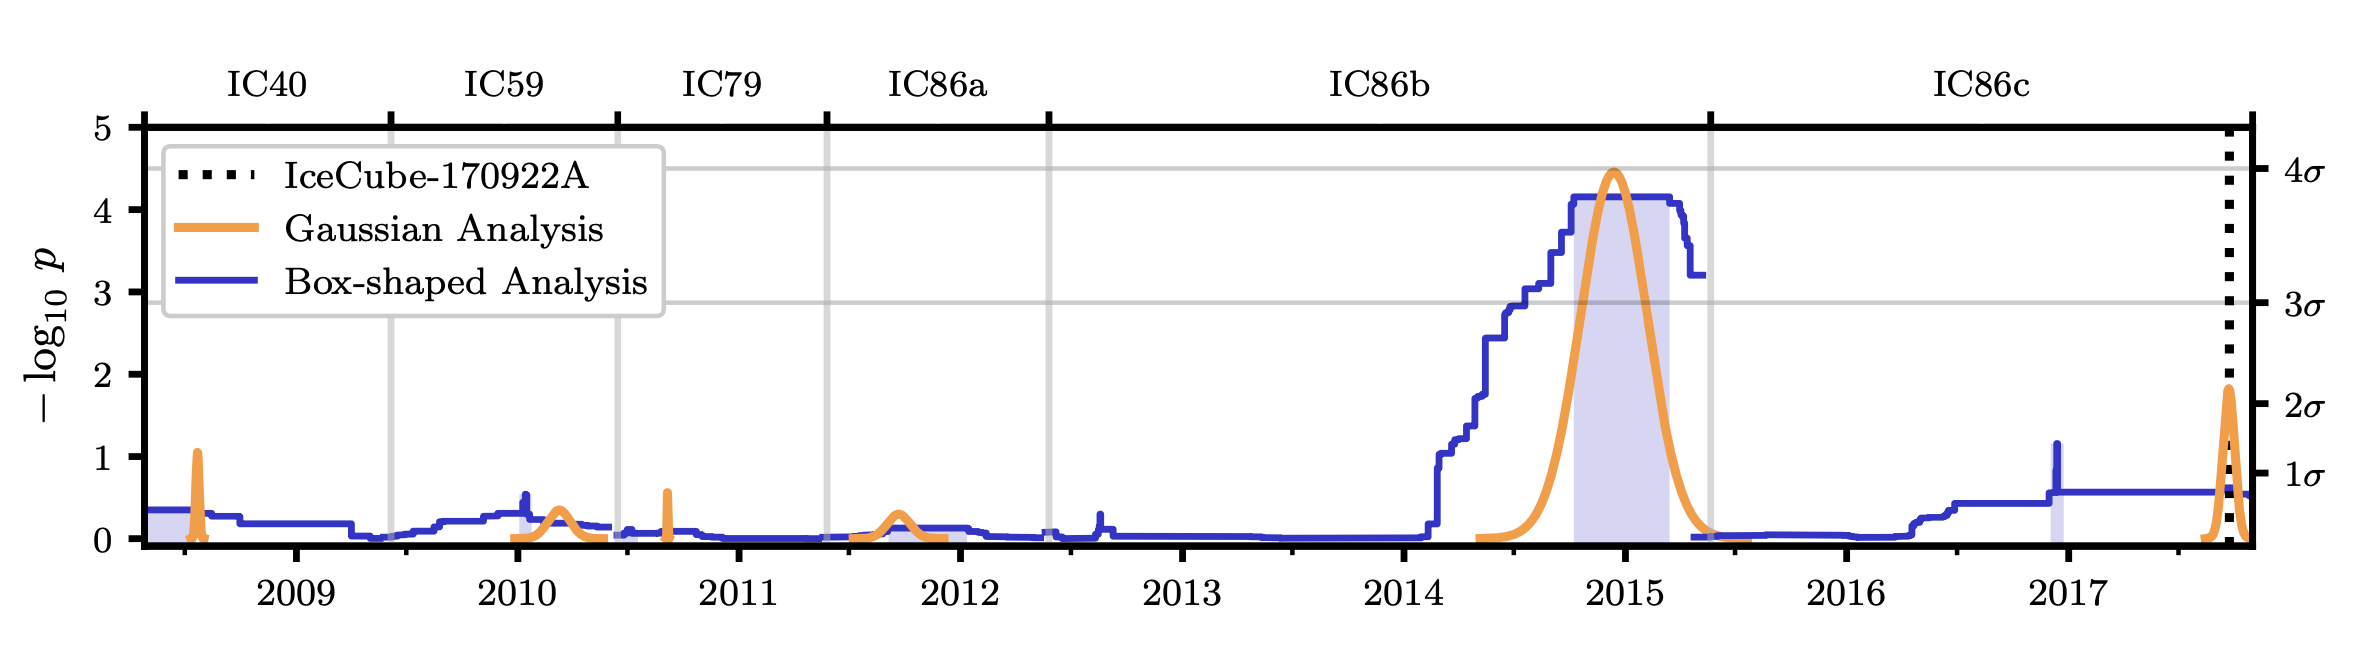
[arXiv:1807.08794v1]
- \(\textcolor[RGB]{255,141,60}{\text{Orange Curve:}}\) corresponds to the analysis using the Gaussian-shaped TDF.
- Central time \(T_0\) and width \(T_W\) are plotted for the most significant findings
- p-value: height of the peak
- \(\textcolor[RGB]{18,54,190}{\text{Blue Curve}}\): corresponds to the analysis using the Box-shaped TDF.
- The curve traces the outer edge of the superposition of the best-fitting time windows over all times \(T_0\)
- significance: height of that window
Neutrinos from the direction of TXS 0506+056
Results of Time-Dependent Analysis
[arXiv:1807.08794v1]
- IC86b from 2012 to 2015, contains a significant excess which is identified by both time-window shapes.
- The excess consists of \(13 \pm 5\) events above the expectation from the atmospheric background.
Neutrinos from the direction of TXS 0506+056
Results of Time-Dependent Analysis
- The significance depends on the energies of the events, their proximity to the coordinates of TXS 0506+056, and their clustering in time.
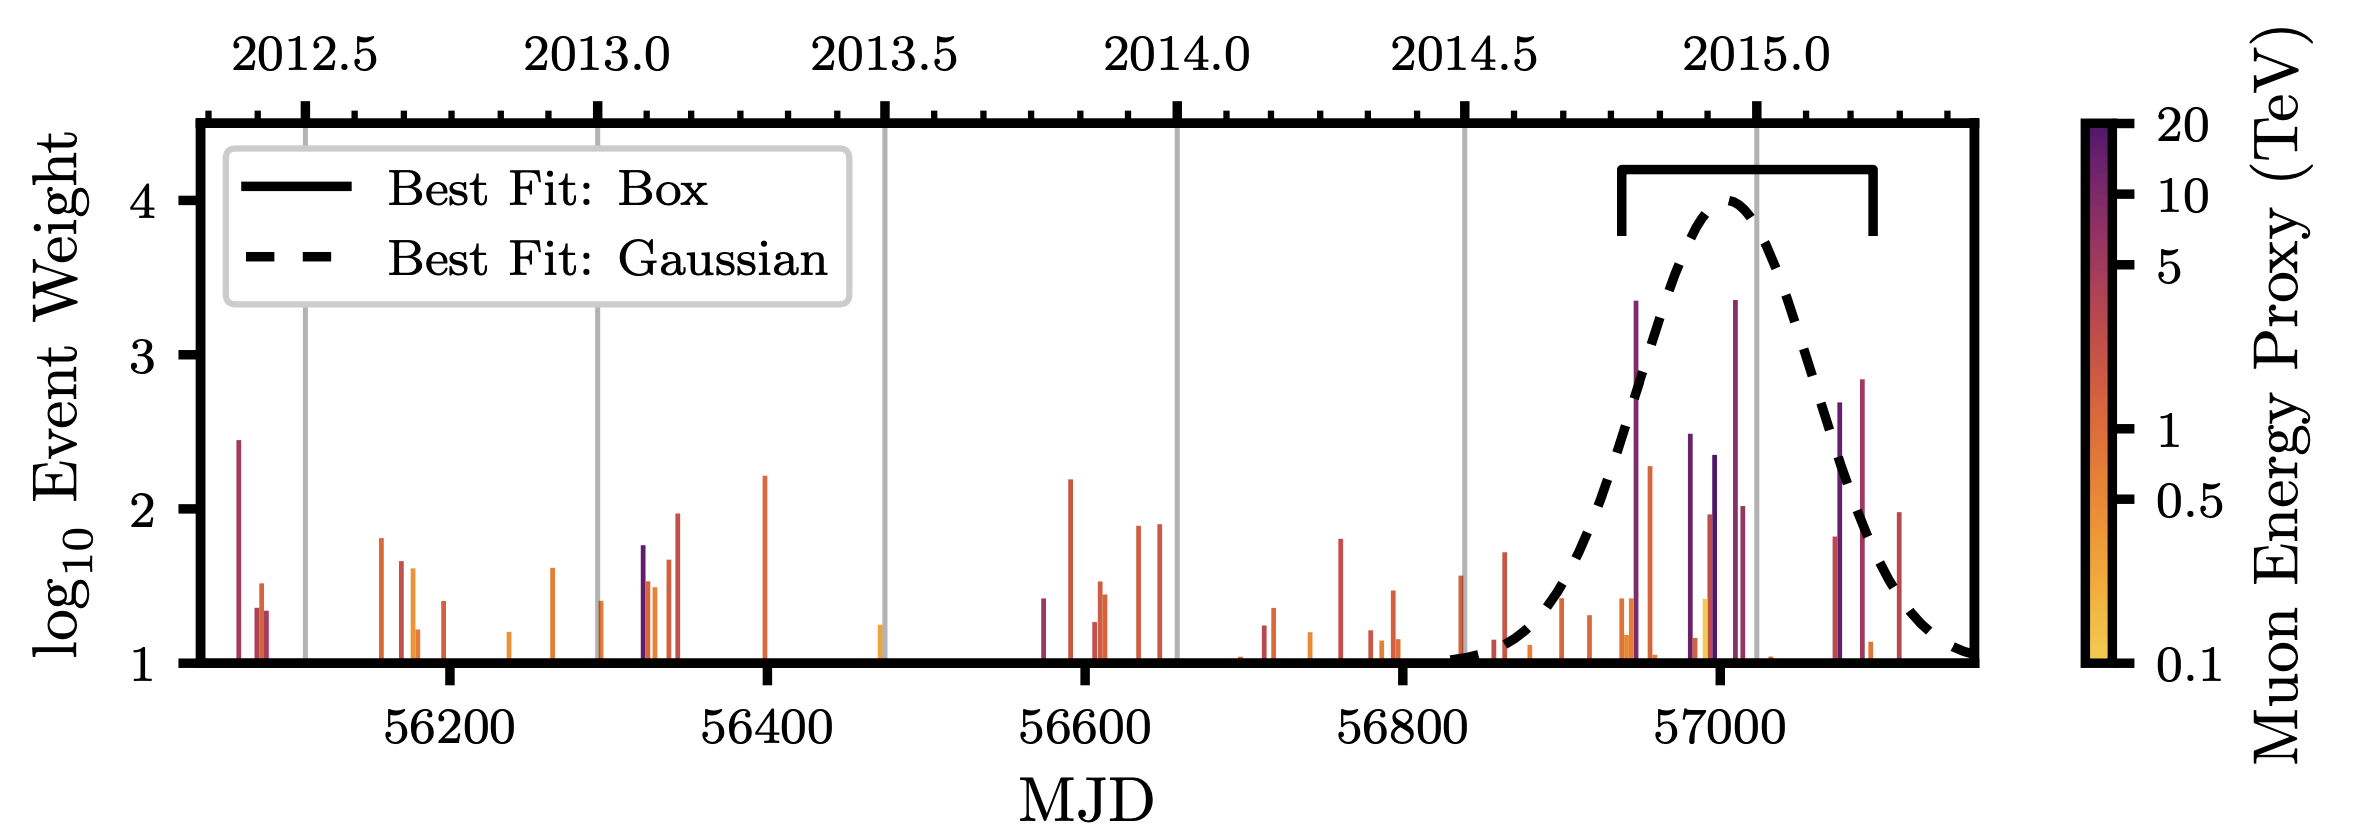
[arXiv:1807.08794v1]
Event Weight: product of event’s spatial term and energy term in the unbinned likelihood analysis at the location of TXS 0506+056 and assuming \(\gamma = 2.1\)
Muon Energy Proxy: approximate value in units of TeV of the reconstructed muon energy.
Neutrinos from the direction of TXS 0506+056
Results of Time-Dependent Analysis
- Joint uncertainty on Gaussian shape fitted parameters holding the time parameters fixed (T0 = 13 December 2014, TW = 110 days)
- Skymap showing the p value of the time-dependent analysis performed at the coordinates of TXS 0506+056 (cross) and at surrounding locations, during IC86b data period.
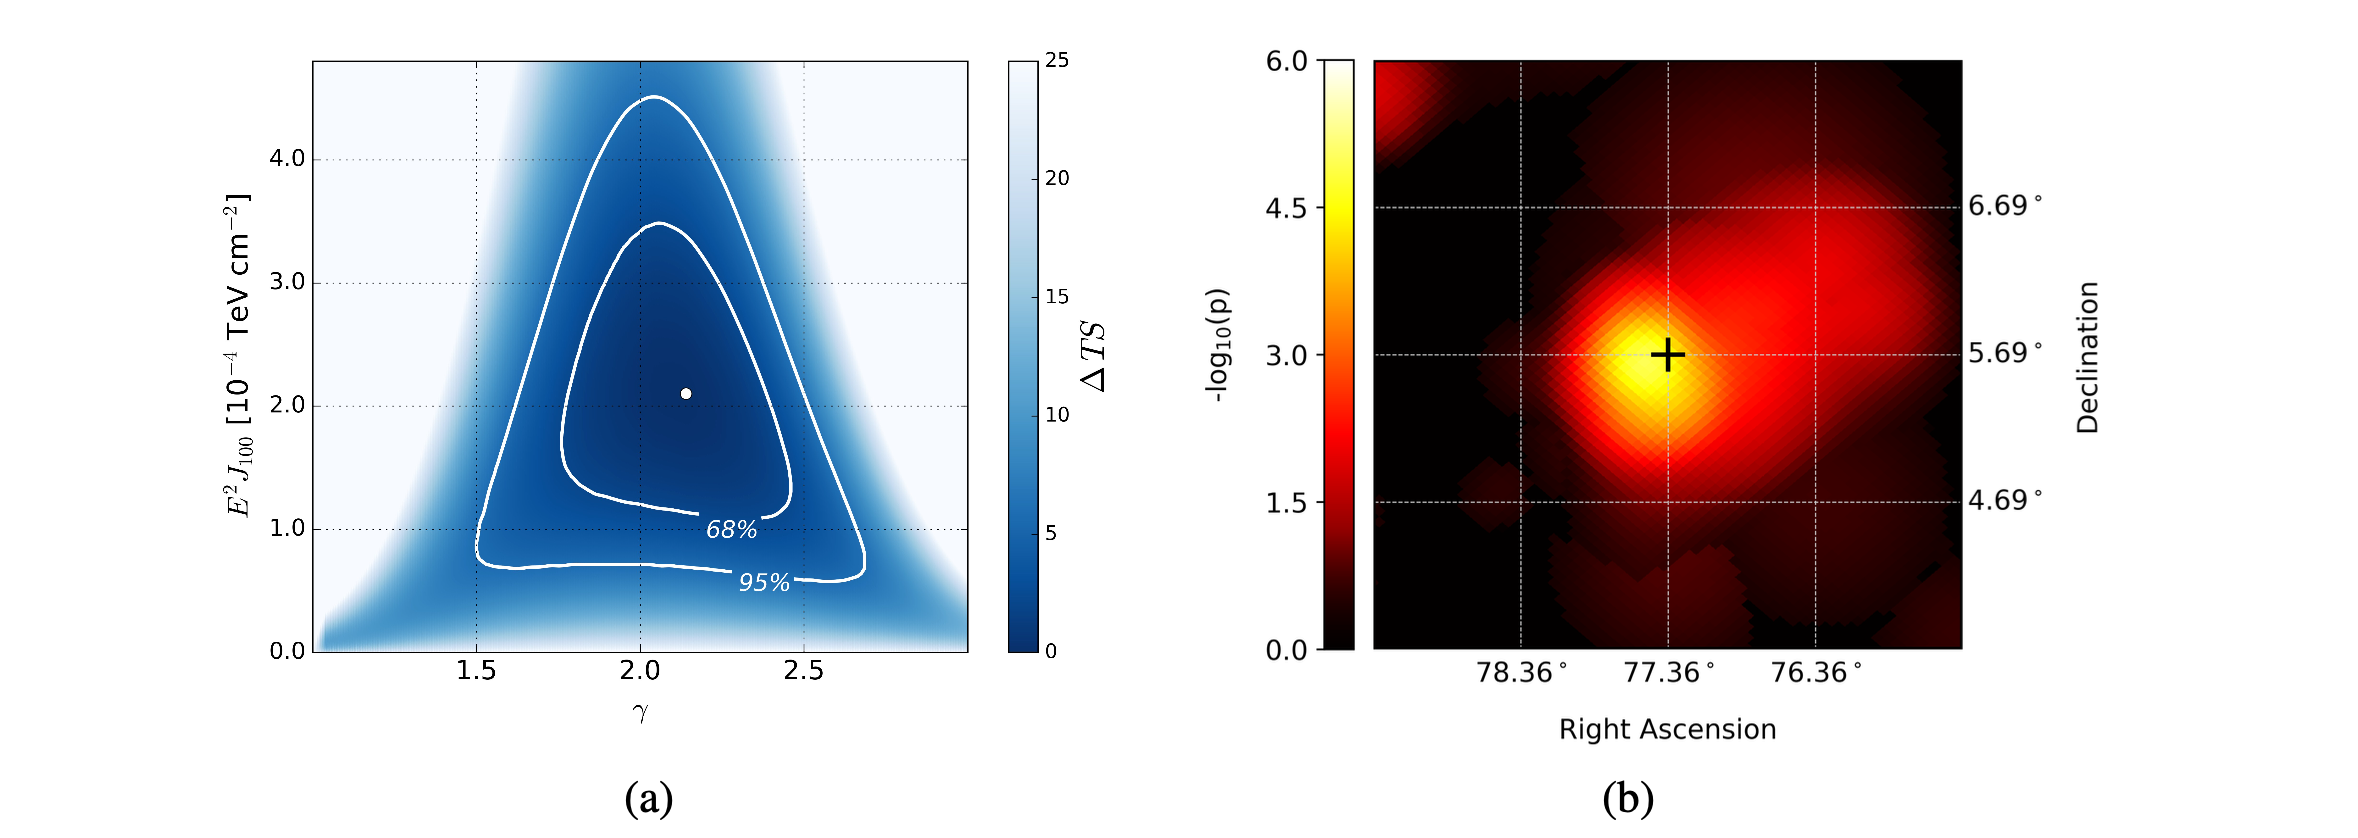
[arXiv:1807.08794v1]
Neutrinos from the direction of TXS 0506+056
Results of Time-Dependent Analysis
- Outside the 2012-2015 time period, the next most significant excess is found using the Gaussian window in 2017 and includes the IceCube-170922A event.
- Centered at 22 September 2017 with duration \(T_W = 19\) days, \(\gamma = 1.7 \pm 0.6\), and fluence \(E^2J = 0.2^{+0.4}_{-0.2} × 10^{−4} \text{ TeV cm}^{−2}\) at \(100 \text{ TeV}\).
- No other event besides the IceCube-170922A event contributes significantly to the best-fit.
[arXiv:1807.08794v1]
Neutrinos from the direction of TXS 0506+056
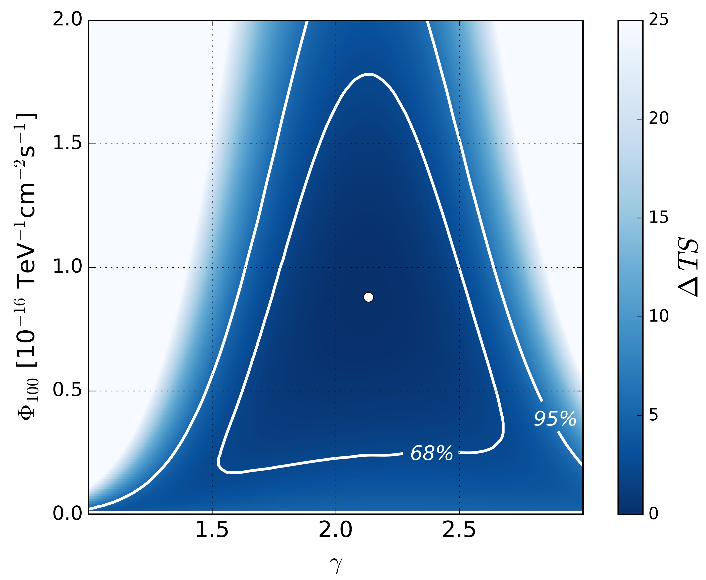
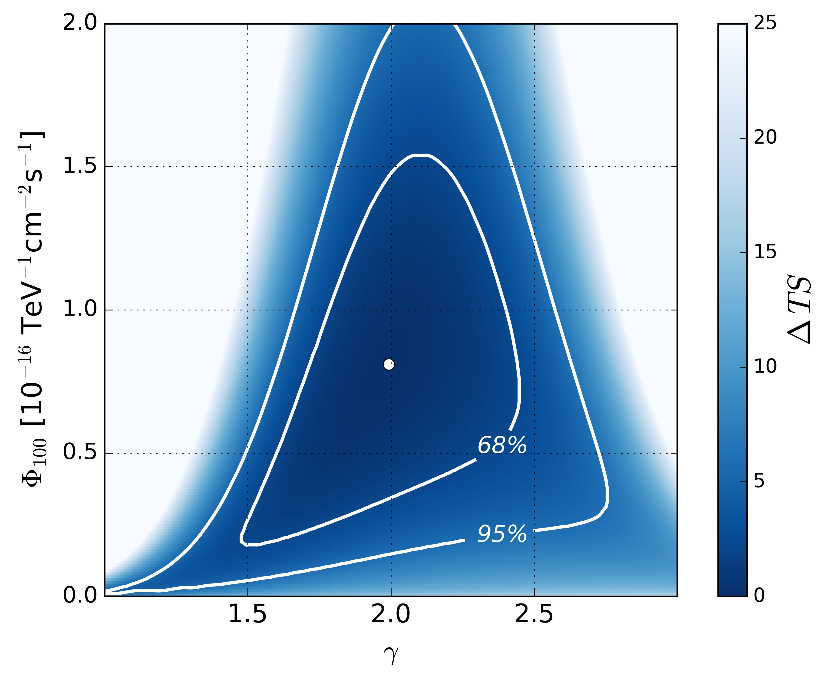
Results of Time-Integrated Analysis
- The analysis is performed using the full data sample
Best fitting parameters:
- Full 9.5-year sample best fit \(\textcolor[RGB]{230,65,115}{(a \; posteriori)}\):
- \(\Phi_{100} = (0.8^{+0.5}_{-0.4}) \times 10^{-16} \text{ TeV}^{-1} \text{ cm}^{-2} \text{s}^{-1}\),
- \(\gamma = 2.0 \pm 0.3\).
- P value: \(0.002\% (4.1σ)\).
- 7-year sample best fit \(\textcolor[RGB]{230,65,115}{(No \; IC86c)}\):
- \(\Phi_{100} = (0.9^{+0.6}_{-0.5}) \times 10^{-16} \text{ TeV}^{-1} \text{ cm}^{-2} \text{s}^{-1}\),
- \(\gamma = 2.1 \pm 0.3\).
- P value: \(1.6\% (2.1σ)\).
[arXiv:1807.08794v1]